If you don’t have data to visualize, you can load an example table:
Code
import ibis
import ibis.selectors as s

ibis.options.interactive = True

t = ibis.examples.penguins.fetch()
t.head(3)
┏━━━━━━━━━┳━━━━━━━━━━━┳━━━━━━━━━━━━━━━━┳━━━━━━━━━━━━━━━┳━━━━━━━━━━━━━━━━━━━┳━━━━━━━━━━━━━┳━━━━━━━━┳━━━━━━━┓
┃ species ┃ island    ┃ bill_length_mm ┃ bill_depth_mm ┃ flipper_length_mm ┃ body_mass_g ┃ sex    ┃ year  ┃
┡━━━━━━━━━╇━━━━━━━━━━━╇━━━━━━━━━━━━━━━━╇━━━━━━━━━━━━━━━╇━━━━━━━━━━━━━━━━━━━╇━━━━━━━━━━━━━╇━━━━━━━━╇━━━━━━━┩
│ string  │ string    │ float64        │ float64       │ int64             │ int64       │ string │ int64 │
├─────────┼───────────┼────────────────┼───────────────┼───────────────────┼─────────────┼────────┼───────┤
│ Adelie  │ Torgersen │           39.1 │          18.7 │               181 │        3750 │ male   │  2007 │
│ Adelie  │ Torgersen │           39.5 │          17.4 │               186 │        3800 │ female │  2007 │
│ Adelie  │ Torgersen │           40.3 │          18.0 │               195 │        3250 │ female │  2007 │
└─────────┴───────────┴────────────────┴───────────────┴───────────────────┴─────────────┴────────┴───────┘
Using plotnine with Ibis
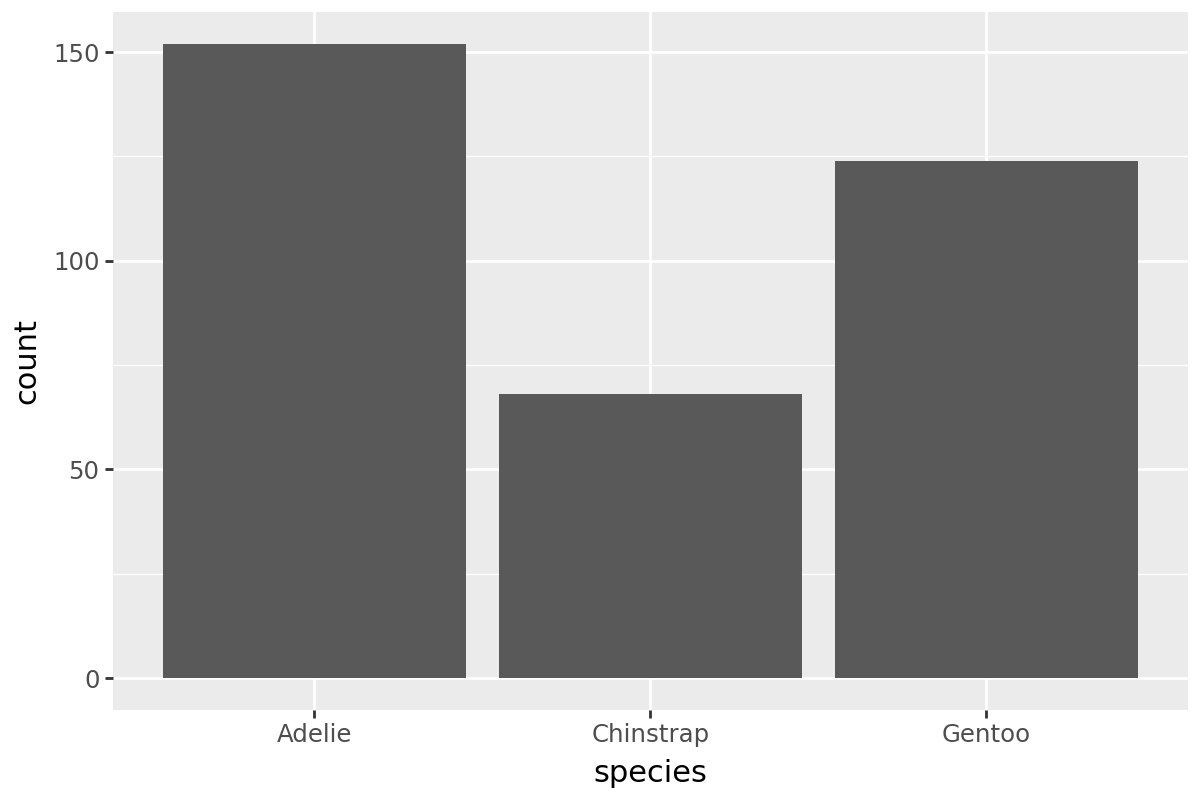
Refer to the plotnine documentation. You can pass in Ibis tables or expressions:
from plotnine import ggplot, aes, geom_bar, theme

chart = (
    ggplot(
        t.group_by("species").agg(count=ibis._.count()),
        aes(x="species", y="count"),
    )
    + geom_bar(stat="identity")
    + theme(figure_size=(6, 4))
)
chart
Back to top