If you don’t have data to visualize, you can load an example table:
Code
import ibisimport ibis.selectors as s= True = ibis.examples.penguins.fetch()3 )
┏━━━━━━━━━┳━━━━━━━━━━━┳━━━━━━━━━━━━━━━━┳━━━━━━━━━━━━━━━┳━━━━━━━━━━━━━━━━━━━┳━━━━━━━━━━━━━┳━━━━━━━━┳━━━━━━━┓
┃ species ┃ island    ┃ bill_length_mm ┃ bill_depth_mm ┃ flipper_length_mm ┃ body_mass_g ┃ sex    ┃ year  ┃
┡━━━━━━━━━╇━━━━━━━━━━━╇━━━━━━━━━━━━━━━━╇━━━━━━━━━━━━━━━╇━━━━━━━━━━━━━━━━━━━╇━━━━━━━━━━━━━╇━━━━━━━━╇━━━━━━━┩
│ string  │ string    │ float64        │ float64       │ int64             │ int64       │ string │ int64 │
├─────────┼───────────┼────────────────┼───────────────┼───────────────────┼─────────────┼────────┼───────┤
│ Adelie  │ Torgersen │           39.1 │          18.7 │               181 │        3750 │ male   │  2007 │
│ Adelie  │ Torgersen │           39.5 │          17.4 │               186 │        3800 │ female │  2007 │
│ Adelie  │ Torgersen │           40.3 │          18.0 │               195 │        3250 │ female │  2007 │
└─────────┴───────────┴────────────────┴───────────────┴───────────────────┴─────────────┴────────┴───────┘
Using matplotlib with Ibis
Refer to the matplotlib documentation . matplotlib has not implemented the dataframe interchange protocol so it is recommended to call to_pandas() on the Ibis table before plotting.
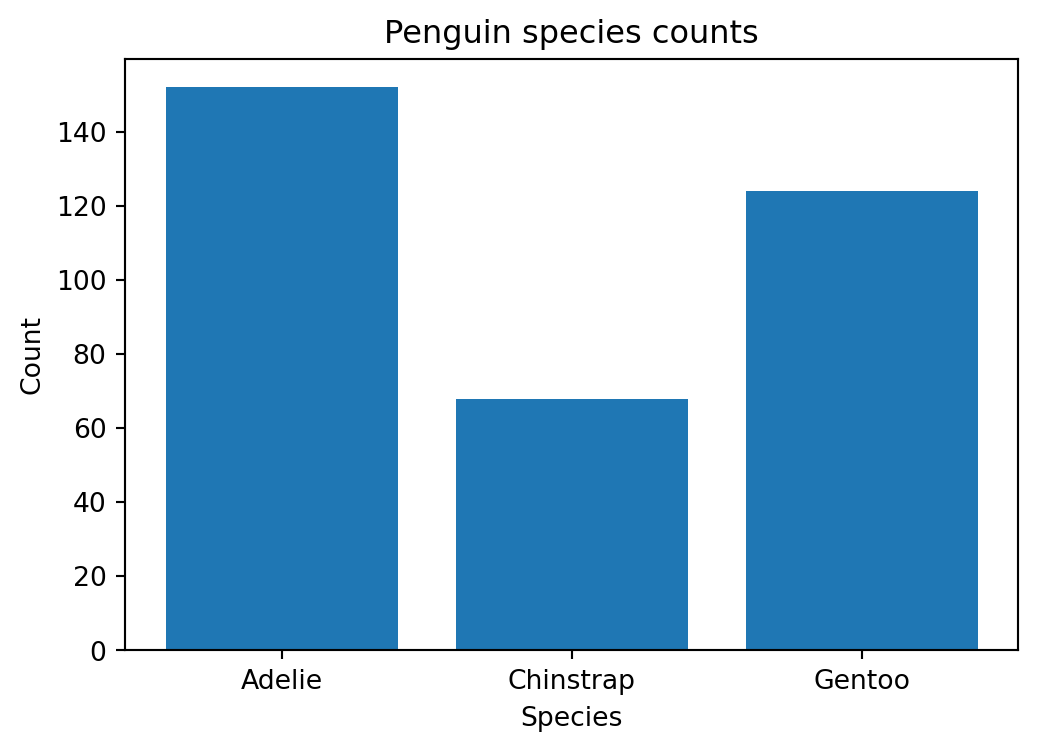
import matplotlib.pyplot as plt= t.group_by("species" ).aggregate(count= ibis._.count())= grouped.mutate(row_number= ibis.row_number().over()).select("row_number" ,~ s.cols("row_number" ) & s.all ()# see https://github.com/ibis-project/ibis/issues/6803
┏━━━━━━━━━━━━┳━━━━━━━━━━━┳━━━━━━━┓
┃ row_number ┃ species   ┃ count ┃
┡━━━━━━━━━━━━╇━━━━━━━━━━━╇━━━━━━━┩
│ int64      │ string    │ int64 │
├────────────┼───────────┼───────┤
│          0 │ Adelie    │   152 │
│          1 │ Chinstrap │    68 │
│          2 │ Gentoo    │   124 │
└────────────┴───────────┴───────┘
# https://stackoverflow.com/questions/9101497/matplotlib-bar-graph-x-axis-wont-plot-string-values = (6 , 4 ))"row_number" ].to_pandas(), grouped["count" ].to_pandas())"Penguin species counts" )"Species" )"row_number" ].to_pandas(), grouped["species" ].to_pandas())"Count" )