If you don’t have data to visualize, you can load an example table:
Code
import ibisimport ibis.selectors as s= True = ibis.examples.penguins.fetch()3 )
┏━━━━━━━━━┳━━━━━━━━━━━┳━━━━━━━━━━━━━━━━┳━━━━━━━━━━━━━━━┳━━━━━━━━━━━━━━━━━━━┳━━━━━━━━━━━━━┳━━━━━━━━┳━━━━━━━┓
┃ species ┃ island    ┃ bill_length_mm ┃ bill_depth_mm ┃ flipper_length_mm ┃ body_mass_g ┃ sex    ┃ year  ┃
┡━━━━━━━━━╇━━━━━━━━━━━╇━━━━━━━━━━━━━━━━╇━━━━━━━━━━━━━━━╇━━━━━━━━━━━━━━━━━━━╇━━━━━━━━━━━━━╇━━━━━━━━╇━━━━━━━┩
│ string  │ string    │ float64        │ float64       │ int64             │ int64       │ string │ int64 │
├─────────┼───────────┼────────────────┼───────────────┼───────────────────┼─────────────┼────────┼───────┤
│ Adelie  │ Torgersen │           39.1 │          18.7 │               181 │        3750 │ male   │  2007 │
│ Adelie  │ Torgersen │           39.5 │          17.4 │               186 │        3800 │ female │  2007 │
│ Adelie  │ Torgersen │           40.3 │          18.0 │               195 │        3250 │ female │  2007 │
└─────────┴───────────┴────────────────┴───────────────┴───────────────────┴─────────────┴────────┴───────┘
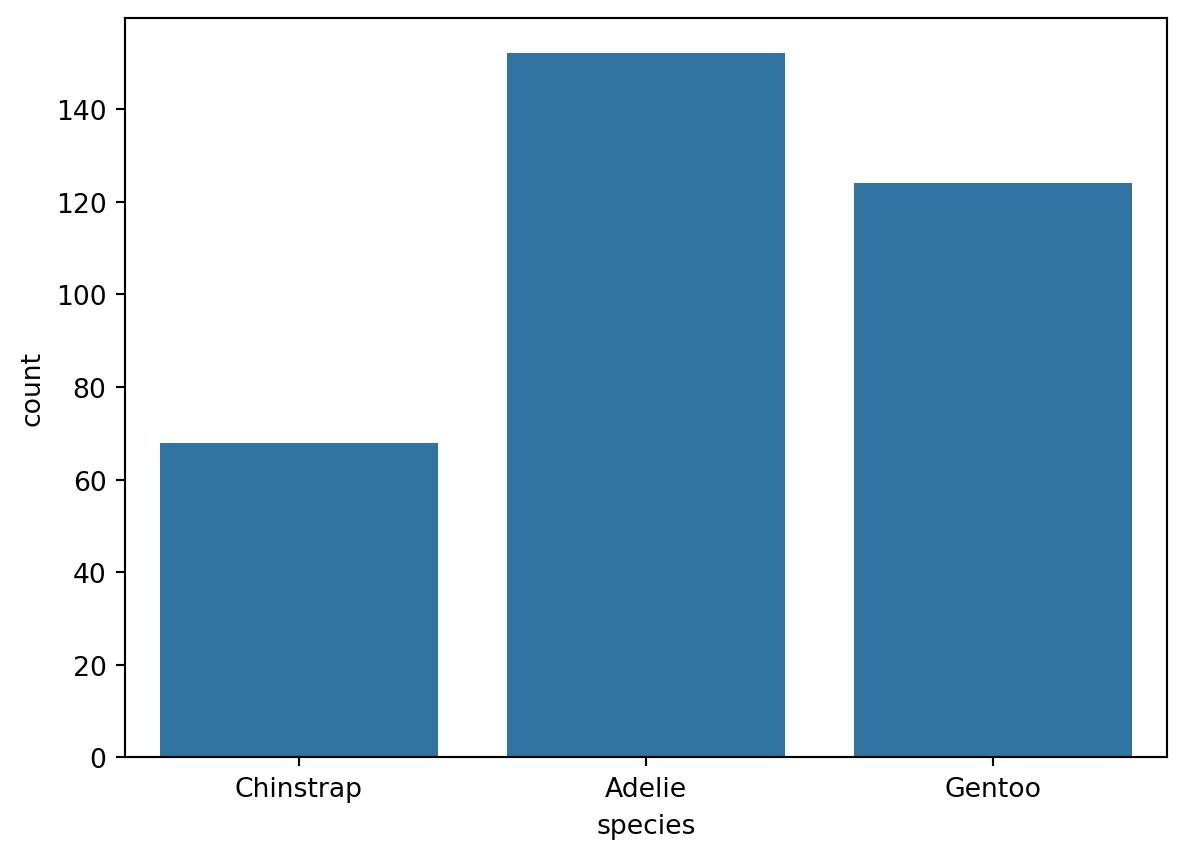
Using seaborn with Ibis
Refer to the seaborn documentation . matplotlib has not implemented the dataframe interchange protocol so it is recommended to call to_pandas() on the Ibis table before plotting.
import seaborn as sns"species" ).aggregate(count= ibis._.count()).to_pandas(),= "species" ,= "count" ,